Visualizing Exercise Data from Strava
INTRODUCTION
My wife introduced me to cycling in 2014 - I fell in love with it and went all in. That first summer after buying my bike, I rode over 500 miles (more on that below). My neighbors at the time, also cyclists, introduced me to the app Strava. Ever since then, I’ve tracked all of my rides, runs, hikes, walks (perhaps not really exercise that needs to be tracked… but I hurt myself early in 2018 and that’s all I could do for a while), etc. everything I could, I tracked.
I got curious and found a package, rStrava, where I can download all of my activity. Once I had it, I put it into a few visualizations.
ESTABLISH STRAVA AUTHENTICATION
First thing I had to do was set up a Strava account and application. I found some really nice instructions on another blog that helped walk me through this.
After that, I installed rStrava and set up authentication (you only have to do this the first time).
## INSTALLING THE NECESSARY PACKAGES
install.packages("devtools")
devtools::install_github('fawda123/rStrava')

## LOAD THE LIBRARY
library(rStrava)

## ESTABLISH THE APP CREDENTIALS
name <- 'jakelearnsdatascience'
client_id  <- '31528'
secret <- 'MY_SECRET_KEY'

## CREATE YOUR STRAVA TOKEN
token <- httr::config(token = strava_oauth(name, client_id, secret, app_scope = "read_all",
                                           cache = TRUE))
## cache = TRUE is optional - but it saves your token to the working directory
GET MY EXERCISE DATA
Now that authentication is setup, using the rStrava package to pull activity data is relatively straightforward.
library(rStrava)

## LOAD THE TOKEN (AFTER THE FIRST TIME)
stoken <- httr::config(token = readRDS(oauth_location)[[1]])

## GET STRAVA DATA USING rStrava FUNCTION FOR MY ATHLETE ID
my_act <- get_activity_list(stoken)
This function returns a list of activities. class(my_act): list.
In my case, there are 439 activies.
FORMATTING THE DATA
To make the data easier to work with, I convert it to a data frame. There are many more fields than I’ve selected below - these are all I want for this post.
info_df <- data.frame()
for(act in 1:length(my_act)){
        tmp <- my_act[[act]]

        tmp_df <- data.frame(name = tmp$name,
                             type = tmp$type,
                             distance = tmp$distance,
                             moving_time = tmp$moving_time,
                             elapsed_time = tmp$elapsed_time,
                             start_date = tmp$start_date_local,
                             total_elevation_gain = tmp$total_elevation_gain,
                             trainer = tmp$trainer,
                             manual = tmp$manual,
                             average_speed = tmp$average_speed,
                             max_speed = tmp$max_speed)

        info_df <- rbind(info_df, tmp_df)
}
I want to convert a few fields to units that make more sense for me (miles, feet, hours instead of meters and seconds). I’ve also created a number of features, though I’ve suppressed the code here. You can see all of the code on github.
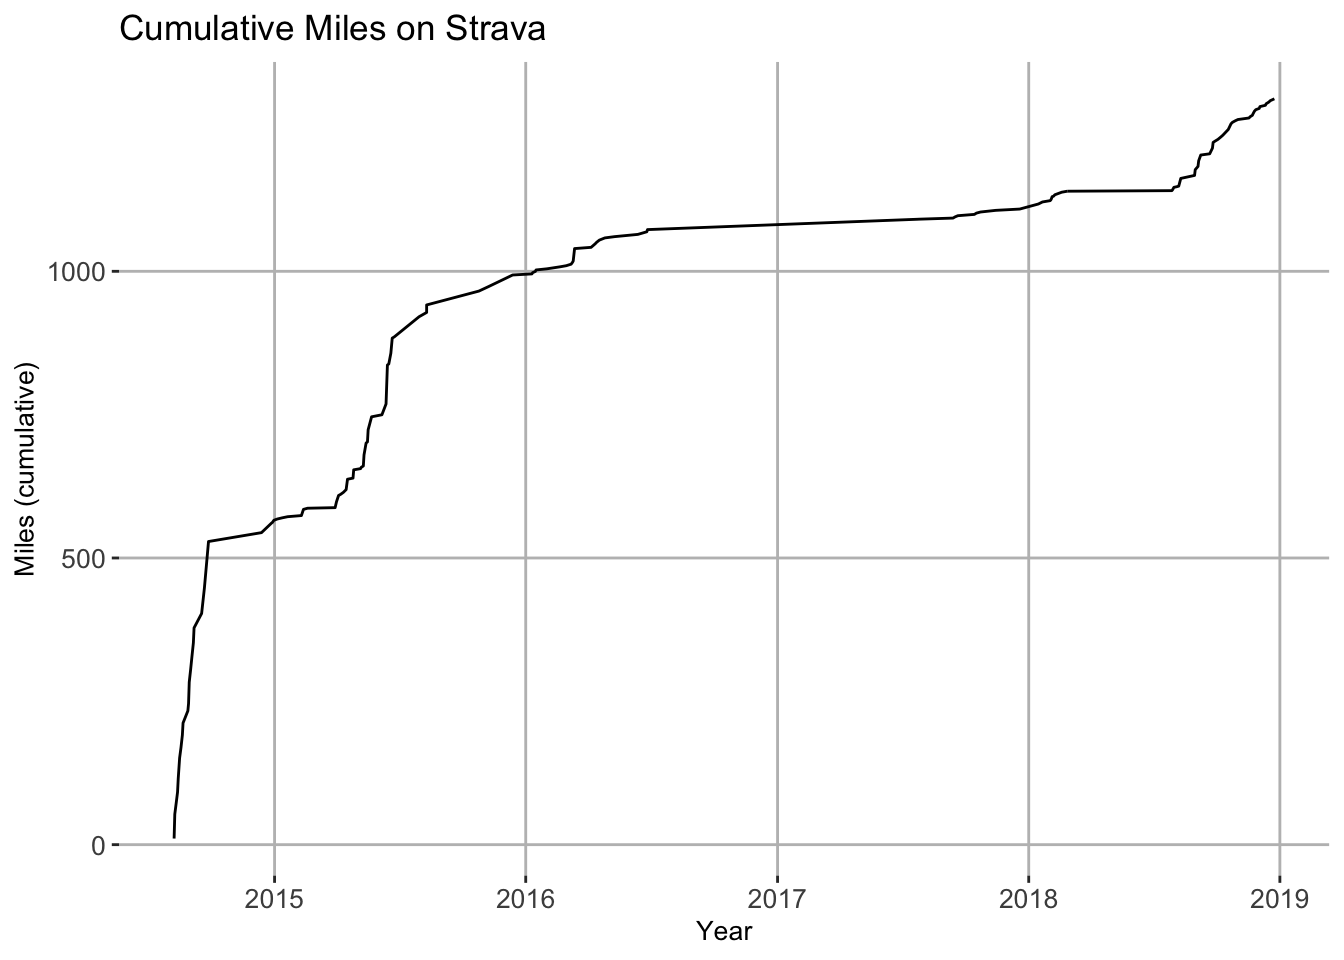
HOW FAR HAVE I GONE?
Since August 08, 2014, I have - under my own power - traveled 1300.85 miles. There were a few periods without much action (a whole year from mid-2016 through later-2017), which is a bit sad. The last few months have been good, though.
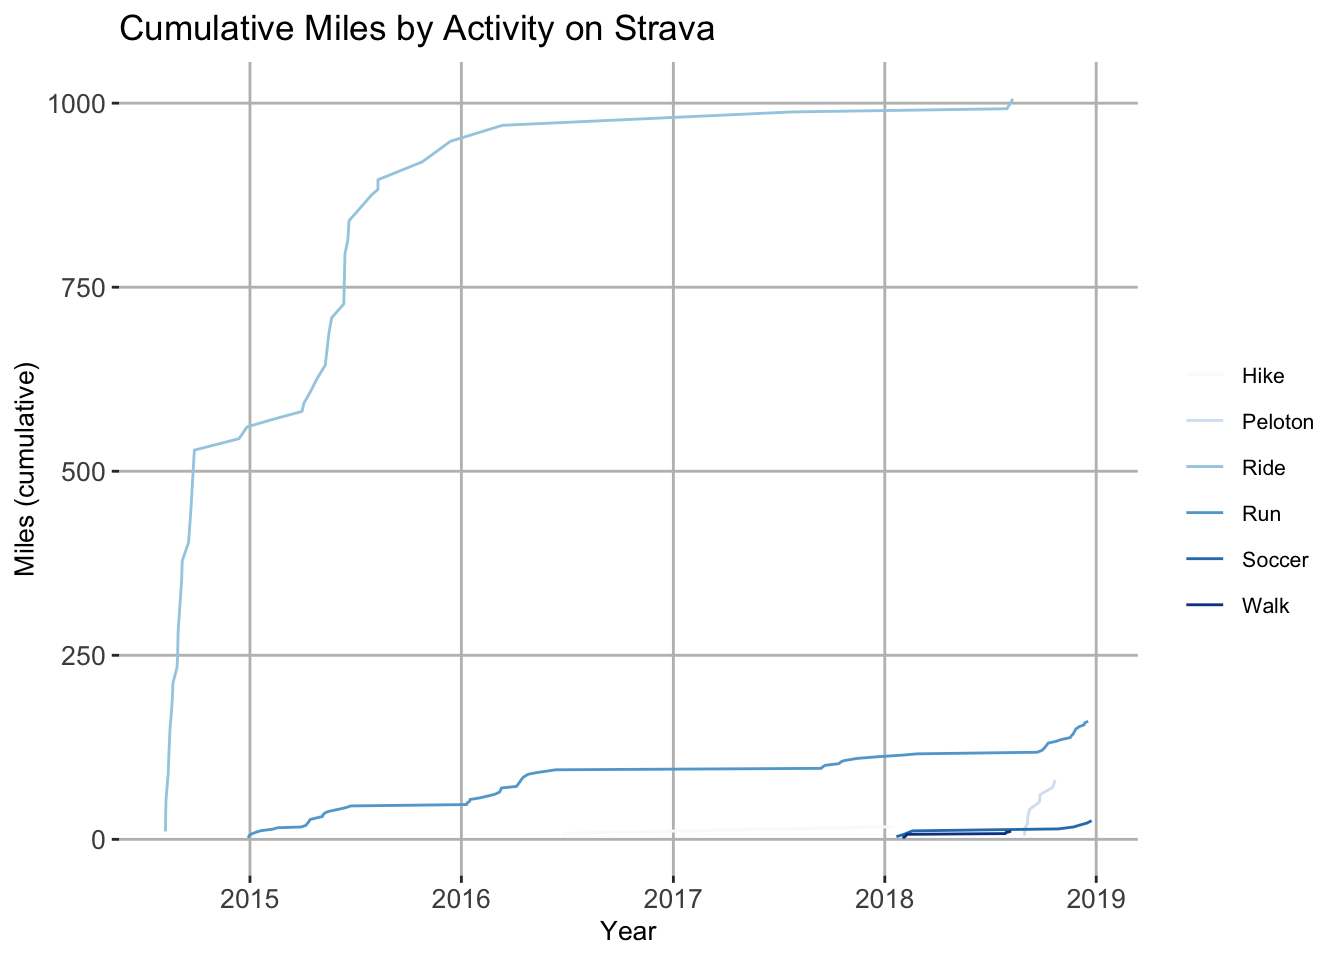
Here’s a similar view, but split by activity.
- I’ve been running recently.
- I haven’t really ridden my bike since the first 2 summers I had it.
- I rode the peloton when we first got it, but not since.
- I was a walker when I first tore the labrum in my hip in early 2018.
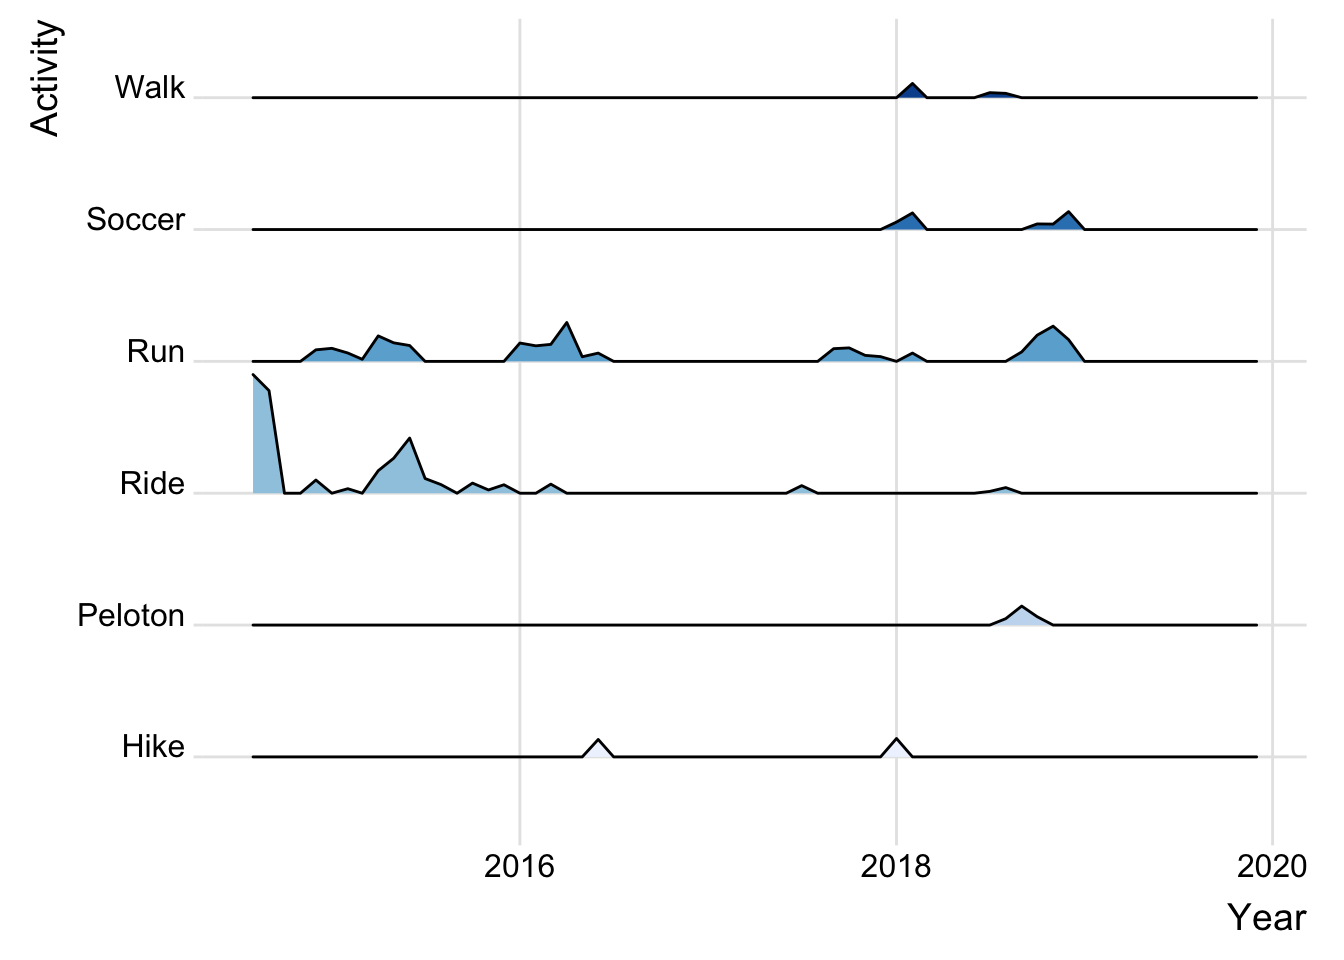
Finally, here’s the same data again, but split up in a ridgeplot.
SUMMARY
There’s a TON of data that is returned by the Strava API. This blog just scratches the surface of analysis that is possible - mostly I am just introducing how to get the data and get up and running.
As a new year’s resolution, I’ve committed to run 312 miles this year. That is 6 miles per week for 52 weeks (for those trying to wrap their head around the weird number). Now that I’ve been able to pull this data, I’ll have to set up a tracker/dashboard for that data. More to come!